Using the CAN Bus of a Viessmann Vitocal 252-A for Data Collection
Learn how to collect advanced data from your Viessmann Vitocal 252-A heat pump using its CAN bus interface. This guide covers connecting with a Raspberry Pi, using Open3e, publishing data via MQTT, and integrating with ioBroker for smart home automation and monitoring.
The Viessmann Vitocal 252-A is a popular heat pump used for residential heating systems. By interfacing with its CAN bus (Controller Area Network), you can collect various metrics from the system - even more than the Viessmann API offers - such as temperature, electrical power, water temperature and operational data. This data can then be forwarded to a home automation system using MQTT and integrated with platforms like ioBroker.
In this article, we will walk through how to connect the CAN bus of a Viessmann Vitocal 252-A heat pump to a Raspberry Pi using a CAN to USB adapter. We will use the Open3e project to read the data from the CAN bus and publish it via MQTT (using Mosquitto) to an ioBroker instance.
Prerequisites
Hardware:
- Viessmann Vitocal 252-A heat pump with a CAN bus interface.
- Raspberry Pi (any version with USB ports; we’ll use RPi 4 for this tutorial).
- CAN to USB Adapter (e.g., PEAK-System PCAN-USB, CANable, or any compatible device - I used a model from Innomaker (1).
- CAN Bus Cable to connect the heat pump’s CAN interface to the adapter.
- Home automation system (like ioBroker) with MQTT support.
- MQTT broker (we’ll use Mosquitto in this tutorial).
Software:
- Raspberry Pi OS installed on your Raspberry Pi.
- Open3e project (available on GitHub).
- Mosquitto MQTT Broker installed on the Raspberry Pi.
- ioBroker installed and configured on your home automation server.
Step 1: Setting Up the CAN to USB Adapter
- Plug the CAN to USB adapter into your Raspberry Pi.
- Connect the CAN bus from your Viessmann Vitocal 252-A heat pump to the adapter. On my heat pump this is the interface 91 - ports 6 (CAN-L), 7 (GND) and 8 (CAN-H):
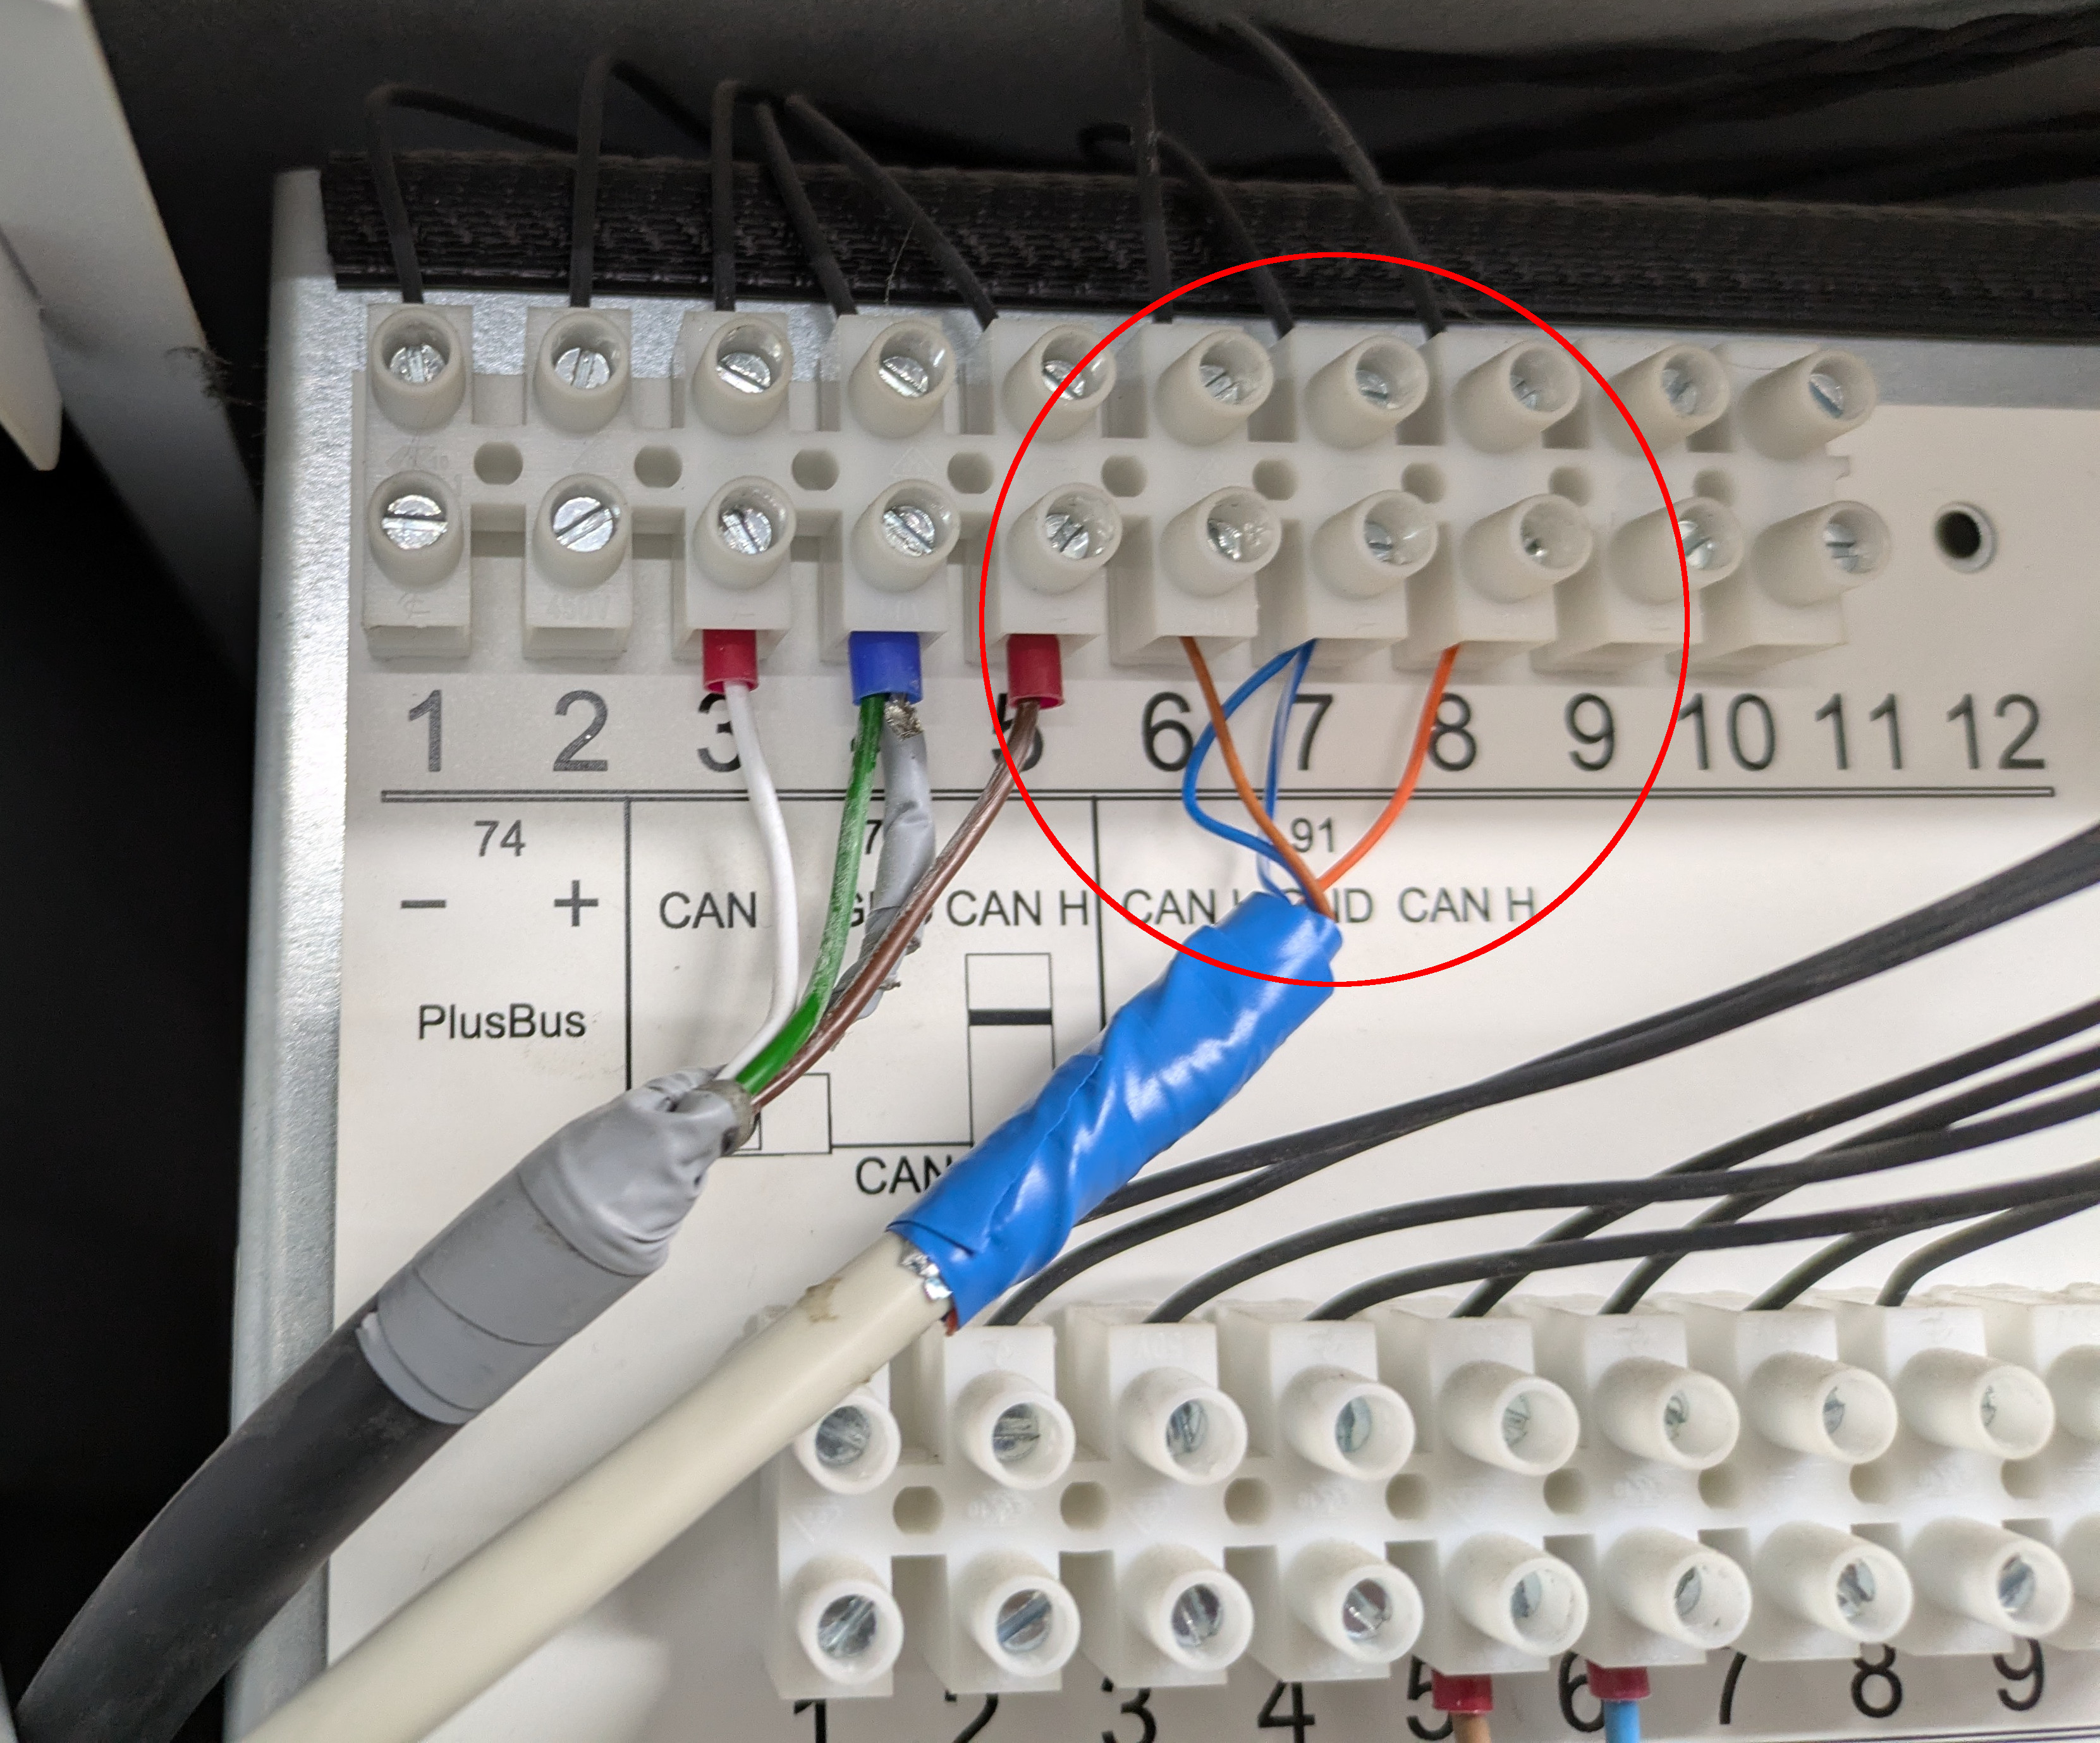
⚡ Note: You should be comfortable working with electrical wiring or consult an electrician for installation. Always prioritize safety.
- Confirm the adapter is recognized by the Raspberry Pi by running the following command:
1

dmesg | grep can
This should show output indicating that the CAN interface is up and running.
-
Configure the CAN interface: In order to read the CAN bus data, we need to set up the CAN interface on the Raspberry Pi. If you are using a USB to CAN adapter like PCAN-USB or CANable, follow these steps:
To bring up the CAN interface, execute the following command:
1

sudo ip link set can0 up type can bitrate 250000
This command configures the CAN interface (
can0) with a baud rate of 500 kbps, which is commonly used for the Vitocal 252-A. -
Test the connection: You can verify the connection to the CAN bus by using the
candumptool:1
candump can0
If the system is connected correctly, you should start seeing CAN frames being printed on the screen.
Step 2: Setting Up Open3e on the Raspberry Pi
The Open3e project is a powerful open-source software designed to read data from heat pumps like the Viessmann Vitocal 252-A via the CAN bus. It provides a way to access and interpret the heat pump data and can publish it to MQTT.
Install required Python Libs
Open3e needs Python to be run, so we will install this by:
1

sudo apt install git python3 python3-pip
We strongly recommend creating a Python virtual environment before installing open3e to avoid conflicts with system packages:
1
2

python3 -m venv ~/open3e-env
source ~/open3e-env/bin/activate
Install Open3e via pip:
To install Open3e from the GitHub repository, run:
1

pip install git+https://github.com/open3e/open3e.git
For the development version with the latest features:
1

pip install git+https://github.com/open3e/open3e.git@develop
Note: If you encounter an “externally-managed-environment” error, either use the virtual environment approach above or add the
--break-system-packagesflag. Using a virtual environment is recommended for better package management.
Create Datapoints:
Open3e scans your CAN bus for all available datapoints. You should run this command once to generate a configuration file with all available devices and addresses:
1

open3e_depictSystem
This creates two important files:
-
devices.json- Configuration file containing all detected devices and their addresses -
Open3Edatapoints_xxx.py- Data points codec definitions for the detected system
This scanning process may take several minutes (typically 10-20 minutes), so please be patient.
Important: Make sure to run this command from the directory where you want to keep your configuration files, as
open3ewill use these files by default.
Run and Test Open3e:
To read data from the heat pump, start Open3e to fetch metrics:
1

open3e -c can0 -r 268,269,271,274,318 -t 30 -v
This command will:
- Connect to the CAN bus on
can0 - Read datapoints 268 (Flow Temperature), 269 (Return Temperature), 271, 274, and 318 (Water Pressure)
- Poll every 30 seconds
- Show verbose output
You can customize the parameters and data points being read. To see all available options:
1

open3e -h
Step 3: MQTT Integration with Mosquitto
Mosquitto is a lightweight MQTT broker that will allow you to send the heat pump data from the Raspberry Pi to your ioBroker instance.
Install Mosquitto MQTT Broker:
To install Mosquitto on the Raspberry Pi, run:
1

sudo apt-get install mosquitto mosquitto-clients
Start the Mosquitto service:
1
2

sudo systemctl enable mosquitto
sudo systemctl start mosquitto
Configure Mosquitto for Authentication (Optional):
You may want to configure Mosquitto with username and password for security. Open the Mosquitto configuration file:
1

sudo nano /etc/mosquitto/mosquitto.conf
Add the following lines to enable authentication:
1
2

allow_anonymous false
password_file /etc/mosquitto/passwd
Then, create the password file:
1

sudo mosquitto_passwd -c /etc/mosquitto/passwd your_username
You’ll be prompted to enter a password.
After editing the configuration file, restart Mosquitto:
1

sudo systemctl restart mosquitto
Publish Data to MQTT:
Once Open3e is running and connected to the CAN bus, it can automatically publish the heat pump data to the MQTT broker. Use the -m option to specify the MQTT broker:
1
2
3
4

open3e -c can0 -r 268,269,271,274,318,320,321,322,324,325,355,381,389,391,396,1043,1769,1771,1772,1775,1776,2333,2334,2346,2351,2487,2488,2496,2735,3016 \
  -m 192.168.0.5:1883:open3e \
  -mfstr "{didNumber:04d}_{didName}" \
  -t 30
This command:
- Connects to MQTT broker at
192.168.0.5:1883 - Publishes to the topic
open3e - Uses a custom format string to name the MQTT topics (e.g.,
0268_FlowTemperatureSensorfor datapoint 268) - Polls every 30 seconds
You can verify the data being published by subscribing to the MQTT topic in another terminal:
1

mosquitto_sub -h 192.168.0.5 -t "open3e/#" -v
This will show all data being published to the MQTT broker in real-time. The data will appear in topics like:
1
2
3

open3e/0268_FlowTemperatureSensor 27.2
open3e/0269_ReturnTemperatureSensor 23.5
open3e/0318_WaterPressureSensor 1.8
Step 4: Integrating with ioBroker
Finally, you need to configure ioBroker to receive the heat pump data. There are two main approaches: using the direct ioBroker adapter (recommended) or subscribing to MQTT topics.
Approach A: Using the ioBroker Adapter (Recommended)
This is the most straightforward approach. The ioBroker.e3oncan adapter connects directly to the CAN bus and reads data without requiring Open3e or MQTT middleware:
Installation:
- Go to the ioBroker Admin interface at
http://localhost:8081 - Navigate to Adapters
- Search for e3oncan and click Install
Configuration:
- Once installed, click on the adapter instance to configure it
- Set the CAN interface to
can0(or your configured CAN interface) - In the Data Points section, configure which data points to read. For the heat pump refrigerant cycle visualization, add these datapoints:
1

268,269,271,274,284,318,320,321,322,324,325,355,381,389,391,396,1043,1769,1771,1772,1775,1776,2333,2334,2346,2351,2487,2488,2496,2735,3016
- Set the Update interval (e.g., 30 seconds)
- Save the configuration
The adapter will automatically create objects in the ioBroker tree that you can use for your dashboards and automation scripts.
Advantage: The ioBroker adapter handles the CAN communication directly and doesn’t require running Open3e separately. This is simpler to maintain and use less system resources.
Approach B: Using MQTT with Open3e
If you prefer or already have Open3e running separately, you can subscribe to MQTT topics in ioBroker:
Installation:
- Go to the ioBroker Admin interface
- Navigate to Adapters, then search for MQTT
- Click Install to install the MQTT adapter
Configuration:
- Once installed, go to the MQTT Adapter settings
- Set the MQTT Broker to the IP address and port of your Mosquitto instance (e.g.,
mqtt://192.168.x.x:1883) - Configure authentication with username and password (if configured in Mosquitto)
- In the MQTT Topics section, enable automatic topic creation so ioBroker will create objects for incoming topics
- Save the configuration
The adapter will automatically subscribe to all topics and create objects in the ioBroker tree as data arrives.
Visualizing Data in ioBroker
After configuring either the e3oncan adapter or MQTT, ioBroker will automatically create objects for each datapoint. You can now:
- Create custom dashboards using ioBroker’s visualization tools
- Monitor the heat pump data in real-time
- Set up alerts and automations based on the data
- Export data for analysis
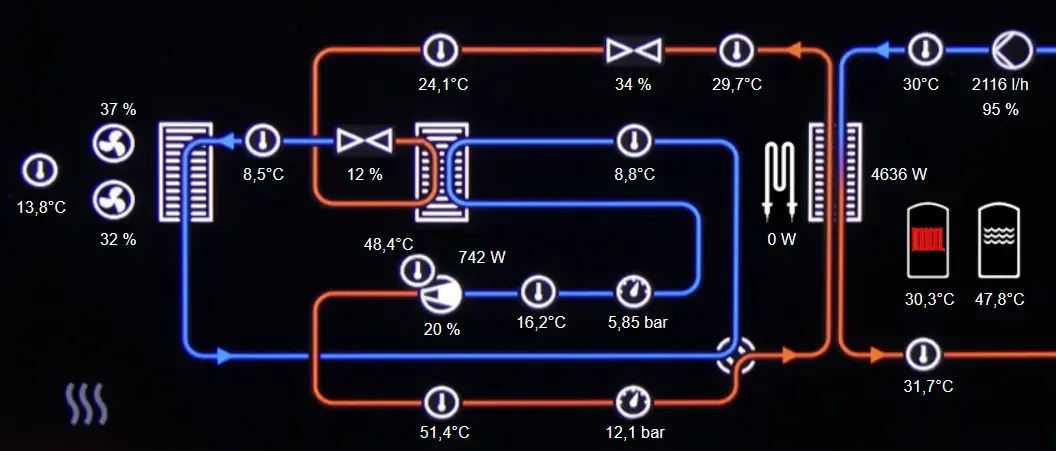
Update: Professional Heat Pump Visualization with iob.vis.vitocal250
As of 2024, there is now an excellent ready-made visualization project specifically designed for the Viessmann Vitocal 250. The iob.vis.vitocal250 project provides a professional, real-time dashboard that displays the refrigerant cycle of your heat pump, similar to the diagnostic display on the heat pump itself.
Features of iob.vis.vitocal250
The visualization includes:
- Refrigerant cycle diagram - Shows the full refrigerant circuit with flow directions and operational status
- Real-time temperature monitoring - All key temperatures (inlet, outlet, compressor, etc.)
- Operational mode indicator - Visual feedback on whether the system is heating or providing hot water
- Power display - Shows electrical and thermal power consumption
- Buffer tank temperatures - Displays temperatures for heating circuit and hot water storage
- Fan and compressor status - Animated indicators for running components
- Optional electric heater display - Visual indication when electric heating is active
Setting up iob.vis.vitocal250
Prerequisites
- ioBroker with visualization module (vis) installed
- Either the e3oncan adapter or open3e with MQTT for data retrieval
- USB-to-CAN adapter connected to your Vitocal
Installation Steps
-
Prepare your data source:
- If using e3oncan adapter: Configure it to read these datapoints:
1

268,269,271,274,284,318,320,321,322,324,325,355,381,389,391,396,1043,1769,1771,1772,1775,1776,2333,2334,2346,2351,2487,2488,2496,2735,3016
- If using open3e, run:
1
2
3
4

open3e -c can0 -r 268,269,271,274,284,318,320,321,322,324,325,355,381,389,391,396,1043,1769,1771,1772,1775,1776,2333,2334,2346,2351,2487,2488,2496,2735,3016 \
  -m localhost:1883:open3e \
  -mfstr "{didNumber:04d}_{didName}" \
  -t 30
- If using e3oncan adapter: Configure it to read these datapoints:
-
Download visualization files:
- Clone or download the iob.vis.vitocal250 repository
- Upload the image files from
img/directory to/vis.0/main/img/using the ioBroker file manager
-
Import the visualization:
- In the ioBroker vis editor, create a new view
- Copy the contents from either:
-
view/Kaeltekreis_e3oncan.json(if using e3oncan adapter) -
view/Kaeltekreis.json(if using open3e)
-
- Paste it into your new view using “copy & paste”
-
Adjust naming if needed:
- If you named your device differently than the default (e.g., “vitocal” instead of “HPMUMASTER”), search and replace accordingly before importing
- If using a different MQTT client or vis instance, update the variable references
-
Optional enhancements:
- Create an alias object for electric heater status to highlight the heater symbol when active
- The fan icon is animated when the fans are running (updated 2024-11-20)
Tip: The iob.vis.vitocal250 visualization significantly enhances your ability to monitor and understand your heat pump’s operation. The visual representation of the refrigerant cycle makes it easy to spot operational anomalies at a glance.
Update: Alternative Integration Methods and Advancements in open3e
Since the original article was published, the open3e project has evolved significantly with improved features and additional integration options:
Latest open3e Features (v0.5+)
-
Complex addressing mode - More flexible data point access (e.g.,
0x680.256.2to read sub-elements) - DoIP support - In addition to CAN, you can now connect to some devices via network using DoIP (Diagnostics over IP Protocol)
- Listener mode - Run open3e continuously and send MQTT commands to read/write data on demand, rather than polling on a schedule
-
Smart Home integrations - Official support for:
- Home Assistant (with dedicated integration)
- ioBroker (via ioBroker.e3oncan adapter)
- Docker deployments
- Node-RED
- Enhanced writing capabilities - Write complex data structures as JSON, not just raw values
-
Improved configuration - Automatic
devices.jsongeneration with device naming support
Running open3e as a Service
For stable, continuous operation, consider running open3e as a systemd service. Create a file /etc/systemd/system/open3e.service:
1
2
3
4
5
6
7
8
9
10
11
12
13
14
15
16
17
18
19
20

[Unit]
Description=Open3e Heat Pump Data Collector
After=network.target

[Service]
Type=simple
User=pi
WorkingDirectory=/home/pi/open3e
Environment="PATH=/home/pi/open3e-env/bin"
ExecStart=/home/pi/open3e-env/bin/python -m open3e \
  -c can0 \
  -r 268,269,271,274,284,318,320,321,322,324,325,355,381,389,391,396,1043,1769,1771,1772,1775,1776,2333,2334,2346,2351,2487,2488,2496,2735,3016 \
  -m localhost:1883:open3e \
  -mfstr "{didNumber:04d}_{didName}" \
  -t 30
Restart=on-failure
RestartSec=10

[Install]
WantedBy=multi-user.target
Then enable and start it:
1
2
3
4

sudo systemctl daemon-reload
sudo systemctl enable open3e
sudo systemctl start open3e
sudo systemctl status open3e
Important note: Only run one instance of open3e at a time to avoid CAN bus conflicts. If you need to read multiple datapoint lists or perform both read and write operations, use listener mode with the
-loption.
Update: Watchdog for Hanging CAN Bus Connections
If your CAN communication occasionally hangs (for example after the heat pump has been powered off and open3e reports timeout errors like Did not receive response), you can add a small reactive watchdog.
The idea is simple: subscribe to the Open3e error MQTT topic, and restart open3e.service immediately when an error message appears.
1. The Script: /home/pi/scripts/open3e_watchdog.sh
1
2
3
4
5
6
7
8
9
10
11
12
13
14
15
16
17
18
19

#!/bin/bash

# Configuration
TOPIC_ERR="open3e/ERR/#"
MQTT_HOST="127.0.0.1"
SERVICE_NAME="open3e.service"

echo "Watchdog started. Waiting for error messages..."

# Listen to error topic and restart open3e on any incoming error message.
mosquitto_sub -h "$MQTT_HOST" -t "$TOPIC_ERR" -v | while read -r line
do
  echo "$(date): Error detected: $line"
  echo "Restarting $SERVICE_NAME..."
  systemctl restart "$SERVICE_NAME"

  # Give open3e and the heat pump some time before reacting to the next error.
  sleep 60
done
2. The Service: /etc/systemd/system/open3e-watchdog.service
Run this service as root so it has full control over systemctl:
1
2
3
4
5
6
7
8
9
10
11
12
13

[Unit]
Description=Open3E Error Watchdog
After=open3e.service

[Service]
Type=simple
User=root
ExecStart=/bin/bash /home/pi/scripts/open3e_watchdog.sh
Restart=always
RestartSec=5

[Install]
WantedBy=multi-user.target
Why this works
- Reactive instead of periodic: The script sleeps while everything is healthy, so it causes almost no CPU load.
-
Immediate response: As soon as an error is published to MQTT, the watchdog restarts
open3eand reinitializes the connection. -
Fault tolerance: The
sleep 60after a restart prevents restart storms while the heat pump is still booting.
Setup and start
Make the script executable:
1

chmod +x /home/pi/scripts/open3e_watchdog.sh
Reload systemd and enable the watchdog:
1
2

sudo systemctl daemon-reload
sudo systemctl enable --now open3e-watchdog.service
Pro tip
If your heat pump needs longer startup times, consider setting RestartSec=30 in open3e.service (instead of very short retries). That gives the hardware more time to stabilize before open3e retries.
Final Thoughts and Recommendations
By following these steps, you can connect the CAN bus of your Viessmann Vitocal heat pump to your home automation system. Whether you use the recommended ioBroker.e3oncan adapter for direct integration or the classic Open3e with MQTT, you’ll gain access to detailed performance data that’s simply not available through the standard Viessmann API.
Recommended Setup Path
For most users, I recommend this approach:
- Install the ioBroker e3oncan adapter - Simplest and most integrated approach
- Set up the iob.vis.vitocal250 visualization - Professional dashboard with minimal effort
- Create automations - Use the real-time data for energy optimization and scheduling
This setup allows you to:
- Monitor the performance of your heat pump in real-time with a professional visualization
- Track important metrics like temperature, pressure, and power consumption
- Detect operational issues early
- Optimize energy use by understanding when your system runs most efficiently
- Integrate this data into broader home automation workflows
Community Resources
The open3e project is actively maintained by a dedicated community. Additional resources and discussions can be found in:
- open3e GitHub repository - Official project and documentation
- open3e Wiki - Detailed setup guides (available in German and English)
- ioBroker community forum - Help with ioBroker integration
- Viessmann community forum - German-language discussions about E3 devices and CAN bus integration
Troubleshooting Tips
-
CAN bus not recognized: Ensure your USB adapter has the correct drivers installed and check with
dmesg | grep can - No data being read: Verify the bitrate is set correctly to 250000, and check that the adapter is properly connected to the heat pump’s CAN interface
- ioBroker objects not appearing: Check that the data points are correctly configured in your adapter settings and that the polling interval is set appropriately
- Performance issues: If you’re polling too many datapoints too frequently, increase the polling interval or reduce the number of datapoints
Affiliate link - if you make a purchase through this link, I may earn a small commission. There are no additional costs for you. Of course, when, where, and how you buy a product is entirely up to you. ↩︎