After upgrading my openmediavault instance to version 6 I decided to add some enhanced monitoring of system. While openmediavault offers some basic monitoring out of the box I decided to add a Grafana dashboard for enhanced statistics.
Grafana is basically just a visualization frontend for the collected data, so I needed to add a backend which collects the data. Because Prometheus is one of the best backend for collecting data from various different data sources, I decided to use this as the backend for Grafana.
Installing Grafana along with Prometheus on openmediavault should be done using Docker. Installing Docker on openmediavault is rather easy by following this tutorial. After installing Docker and Portainer I was ready to start with Grafana and Prometheus.
For my monitoring setup I decided to add a new monitoring stack in Portainer using the following configuration:
1
2
3
4
5
6
7
8
9
10
11
12
13
14
15
16
17
18
19
20
21
22
23
24
25
26
27
28
29
version: '3'

volumes:
  prometheus-data:
    driver: local
  grafana-data:
    driver: local

services:
  prometheus:
    image: prom/prometheus:latest
    container_name: prometheus
    ports:
      - "9090:9090"
    volumes:
      - /srv/raid_md0/Config/prometheus/prometheus.yml:/etc/prometheus/prometheus.yml
      - prometheus-data:/prometheus
    restart: unless-stopped
    command:
      - "--config.file=/etc/prometheus/prometheus.yml"

  grafana:
    image: grafana/grafana-oss:latest
    container_name: grafana
    ports:
      - "3000:3000"
    volumes:
      - grafana-data:/var/lib/grafana
    restart: unless-stopped
To start Prometheus with a custom configuration I bind-mounted the configuration to a local file in my NAS (/srv/raid_md0/Config/prometheus/prometheus.yml:/etc/prometheus/prometheus.yml). The basic configuration of Prometheus was:
1
2
3
4
5
6
7
8
9
10
11
12
global:
  scrape_interval:     15s # By default, scrape targets every 15 seconds.

# A scrape configuration containing exactly one endpoint to scrape:
# Here it's Prometheus itself.
scrape_configs:
  # The job name is added as a label `job=<job_name>` to any timeseries scraped from this config.
  - job_name: 'prometheus'
    # Override the global default and scrape targets from this job every 5 seconds.
    scrape_interval: 5s
    static_configs:
      - targets: ['localhost:9090']
This is the needed configuration to start Prometheus and Grafana with a minimal setup. Since Prometheus runs in a Docker container, it has limited access to scrape-able resources. But the real strength of Prometheus is to gather data from various other data sources.
To get data from openmediavault itself I decided to use the Node exporter which has been created by the Prometheus team itself. This exporter can be used within Docker itself - you just need to bind-mount the root filesystem of the host into the container. The service configuration of the Node exporter looks like:
1
2
3
4
5
6
7
8
9
  node_exporter:
    image: quay.io/prometheus/node-exporter:latest
    container_name: node_exporter
    command:
      - '--path.rootfs=/host'
    pid: host
    restart: unless-stopped
    volumes:
      - '/:/host:ro,rslave'
In addition to the metrics of openmediavault (host) itself, I was interested into some metrics of my Docker services. I found a nice Prometheus exporter for Docker metrics called cAdvisor. The service configuration of cAdvisor looks like:
1
2
3
4
5
6
7
8
9
10
11
12
  cadvisor:
    image: gcr.io/cadvisor/cadvisor:latest
    container_name: cadvisor
    volumes:
      - /:/rootfs:ro
      - /var/run:/var/run:ro
      - /sys:/sys:ro
      - /var/lib/docker/:/var/lib/docker:ro
      - /dev/disk/:/dev/disk:ro
    devices:
      - /dev/kmsg
    restart: unless-stopped
Putting this all together my stack configuration in Portainer looks like:
1
2
3
4
5
6
7
8
9
10
11
12
13
14
15
16
17
18
19
20
21
22
23
24
25
26
27
28
29
30
31
32
33
34
35
36
37
38
39
40
41
42
43
44
45
46
47
48
49
50
51
52
version: '3'

volumes:
  prometheus-data:
    driver: local
  grafana-data:
    driver: local

services:
  prometheus:
    image: prom/prometheus:latest
    container_name: prometheus
    ports:
      - "9090:9090"
    volumes:
      - /srv/dev-disk-by-label-data/Config/prometheus/prometheus.yml:/etc/prometheus/prometheus.yml
      - prometheus-data:/prometheus
    restart: unless-stopped
    command:
      - "--config.file=/etc/prometheus/prometheus.yml"

  grafana:
    image: grafana/grafana-oss:latest
    container_name: grafana
    ports:
      - "3000:3000"
    volumes:
      - grafana-data:/var/lib/grafana
    restart: unless-stopped

  node_exporter:
    image: quay.io/prometheus/node-exporter:latest
    container_name: node_exporter
    command:
      - '--path.rootfs=/host'
    pid: host
    restart: unless-stopped
    volumes:
      - '/:/host:ro,rslave'

  cadvisor:
    image: gcr.io/cadvisor/cadvisor:latest
    container_name: cadvisor
    volumes:
      - /:/rootfs:ro
      - /var/run:/var/run:ro
      - /sys:/sys:ro
      - /var/lib/docker/:/var/lib/docker:ro
      - /dev/disk/:/dev/disk:ro
    devices:
      - /dev/kmsg
    restart: unless-stopped
And the configuration for Prometheus (where you need to add the additional exporters too) looks like:
1
2
3
4
5
6
7
8
9
10
11
12
13
14
15
16
17
18
19
20
21
22
global:
  scrape_interval:     15s # By default, scrape targets every 15 seconds.

# A scrape configuration containing exactly one endpoint to scrape:
# Here it's Prometheus itself.
scrape_configs:
  # The job name is added as a label `job=<job_name>` to any timeseries scraped from this config.
  - job_name: 'prometheus'
    # Override the global default and scrape targets from this job every 5 seconds.
    scrape_interval: 5s
    static_configs:
      - targets: ['localhost:9090']

  # Example job for node_exporter
  - job_name: 'node_exporter'
    static_configs:
      - targets: ['node_exporter:9100']

  # Example job for cadvisor
  - job_name: 'cadvisor'
    static_configs:
      - targets: ['cadvisor:8080']
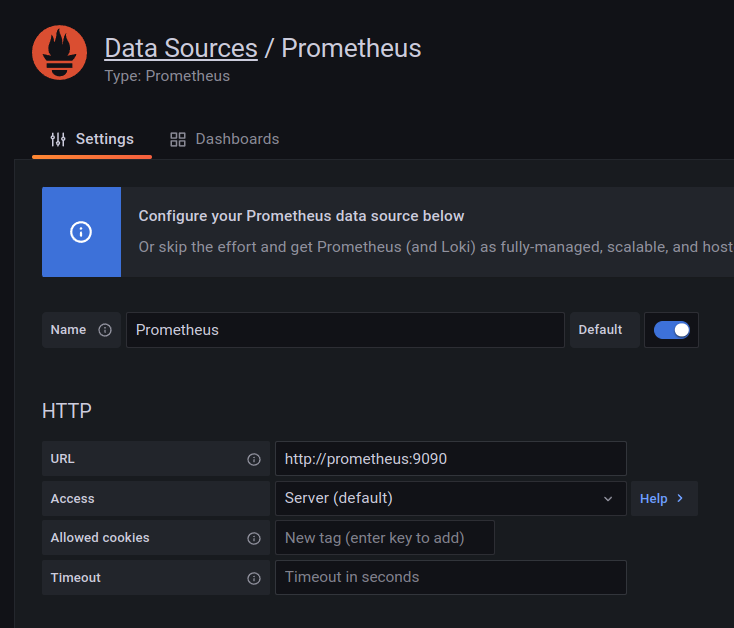
After restarting your Docker stack with the settings above you just need to add Prometheus as your first data source in Grafana by opening the “new datasource” page (e.g. http://nas.lan:3000/datasources/new) and adding the Prometheus instance:
The real hard part is to create a dashboard from scratch. Fortunately Grafana offers to import predefined dashboards from their repository. To use a predefined dashboard, you need to head over to the Dashboard repository and search for a dashboard which suits your needs. A good start would be:
- Node Exporter Full for the Node exporter
- Cadvisor exporter for the cAdvisor exporter
To install a predefined dashboard, you just need to head over to the “new dashboard” page (e.g. http://nas.lan:3000/dashboard/new) and choose Import. In the next page you can either paste the url from the dashboard or the corresponding ID. After pressing Load the dashboard will be downloaded from the dashboard repository and installed in your Grafana instance.
Having those two exporters and the dashboards installed, you will have access to the basic metrics for openmediavault itself and your Docker containers.